Dates and Events: |
OSADL Articles:
2023-11-12 12:00
Open Source License Obligations Checklists even better nowImport the checklists to other tools, create context diffs and merged lists
2022-07-11 12:00
Call for participation in phase #4 of Open Source OPC UA open62541 support projectLetter of Intent fulfills wish list from recent survey
2022-01-13 12:00
Phase #3 of OSADL project on OPC UA PubSub over TSN successfully completedAnother important milestone on the way to interoperable Open Source real-time Ethernet has been reached
2021-02-09 12:00
Open Source OPC UA PubSub over TSN project phase #3 launchedLetter of Intent with call for participation is now available |
New waves with Linux
Analyze the temporal relationship of Linux tasks using the kernel tracer
Developers were asking repeatedly for a graphical tool that makes it possible to visualize the temporal relationship of Linux tasks. Herman ten Brugge recently posted the source code of a converter that does exactly this. Thank you, Herman!
How does it work?
One of the Linux kernel tracers, the sched_switch tracer, records every single task switch and writes important data such as time stamp and name of the task to the trace output. Fortunately, this tracer creates only little overhead; thus, the data do not differ significantly from a situation when the tracer is disabled.
In order to use the kernel tracer, it must be configured when the kernel is built, and the debug file system must be mounted. The latter is done, for example, using the command
# mount -t debugfs nodev /sys/kernel/debug
which, in turn, requires that the sys file system is mounted. Both is best achieved by adding the lines
nodev /sys               sysfs    defaults  0 0
nodev /sys/kernel/debug  debugfs  defaults  0 0
to the file /etc/fstab which ensures that the debug file system is available immediately after reboot without requiring any user interaction. To finally enable the tracer, its name must be written to the current_tracer variable of the tracing virtual file system, and tracing must be enabled:
# echo sched_switch >/sys/kernel/debug/tracing/current_tracer
# echo 1 >/sys/kernel/debug/tracing/tracing_enable
The task switch data are now written continuously into the tracer's data area that is organized as a FIFO. To observe a particular period, the tracer must be stopped at the end of a time period of interest. This can be done from shell level by simply entering
# echo 0 >/sys/kernel/debug/tracing/tracing_enable
or from a C program. Let's cite from Steven Rostedt's tracer documentation (in the file Documentation/ftrace.txt at the top level of the kernel tree):
To disable the tracing directly from a C program, something like following code snippet can be used:
int trace_fd;
[...]
int main(int argc, char *argv[]) {
  [...]
  trace_fd = open("/sys/kernel/debug/tracing/tracing_enabled",
    O_WRONLY);
  [...]
  if (condition_hit()) {
    write(trace_fd, "0", 1);
  }
  [...]
}
Steven Rostedt not only wrote this documentation. More importantly, he is also the author of the tracer - many thanks also to him for providing this important kernel subsystem!
BTW: If you would like to learn more about the various Linux tracers or to say thank you to Steven personally, you may consider attending the 11th Real Time Linux Workshop that will be held in Dresden, Germany, from September 28 to 30, 2009. Steven will be there and give a lecture on kernel tracers.
The final step to the graphical visualization of the task switches is to convert the tracer data to VCD (value change dump) data which Herman ten Brugge's converter does for us:
# cat /sys/kernel/debug/tracing/trace >/tmp/trace.txt
# sched_switch /tmp/trace.txt /tmp/trace.vcd
# gtkwave /tmp/trace.vcd
The program sched_switch is also available in the download area of the OSADL Website. A short explanation is given how to download, compile and use the utility.
How does it look like?
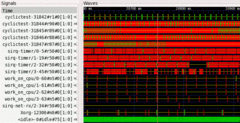
The screen hardcopy below shows a detail of the gtkwave  main window displaying task switch data created with the procedure explained above. The channel labels are given in the above picture. The program cyclictest was running with the command line options -a -t -n -p99 -i100 -d25 on a Core 2 Quad system. The first line is the main task that runs at normal priority. The four child threads of cyclictest are displayed at line #2 to #5. They run at priority 99, 98, 97 and 96. The third pulse of the second thread (at line #3) is somewhat longer than the other. It is clearly visible that this pulse was intercepted by the sirq-timer of CPU #1 (at line #7) and interfered with the first thread. In a similar way, real data of real-life application issues can be displayed, analyzed and solved.


